- HR:+91-879-9184-787
- Sales:+91-908-163-7774

Node.js, with its efficient and scalable architecture, has become a popular choice for building server-side applications. However, ensuring the optimal performance of these applications requires effective monitoring techniques. In this article, we will delve into the world of Nodejs performance monitoring, uncovering various techniques and strategies that can help in optimizing your server’s efficiency.
Nodejs performance monitoring involves analyzing and tracking various metrics, such as response time, request throughput, and memory usage, to identify and resolve performance bottlenecks. By leveraging the right monitoring tools and best practices, you can proactively identify and address issues before they impact the overall performance of your application.
In the following sections, we will explore the factors that influence Node.js performance, understand the importance of monitoring in maintaining application stability, and delve into real-time monitoring techniques. We will also discuss performance testing and benchmarking, the role of metrics and alerts, and how to analyze and address bottlenecks effectively. Furthermore, we will explore scaling and load-balancing techniques to handle high-traffic applications.

Before diving into monitoring techniques, it is essential to understand the factors that impact Node.js performance. Whether you are developing a small application or a large-scale enterprise system, optimizing the performance of your Node.js server is crucial for delivering a smooth and efficient user experience.
Node.js, a runtime environment built on Chrome’s V8 JavaScript engine, offers several advantages like an event-driven, non-blocking I/O model and scalability. Finding a proper monitoring tool or Node js monitoring tool can be a hazardous task. So, to fully access the power of Node.js, it is important to have a solid understanding of Node.js monitoring and its performance characteristics.
One of the key factors that influences Node.js performance is its single-threaded nature. While this design allows for lightweight and high-concurrency applications, it also means that a blocking operation can significantly affect the responsiveness of the server. Thus, it is important to be mindful of blocking operations and use asynchronous programming techniques to ensure smooth code execution.
Additionally, the event loop, a fundamental component of Node.js, plays a critical role in the performance metrics. The event loop allows Node.js to handle multiple connections simultaneously, ensuring efficient resource usage. Understanding how the event loop operates and how it can affect your application’s performance is crucial in optimizing Node.js application performance.
Read More: Installing The Latest Version of Node: A Step-by-Step Guide
Furthermore, the performance of your Node.js application can be influenced by factors such as memory management, CPU utilization, network latency, and database interactions. Gaining insights into these aspects and implementing strategies to mitigate bottlenecks can significantly enhance the overall performance of your application.
In the next section, we will explore the importance of Node.js monitoring and how it can help identify and resolve performance issues proactively. By understanding the factors that impact Node.js performance, you will be better equipped to optimize the efficiency and responsiveness of your server.
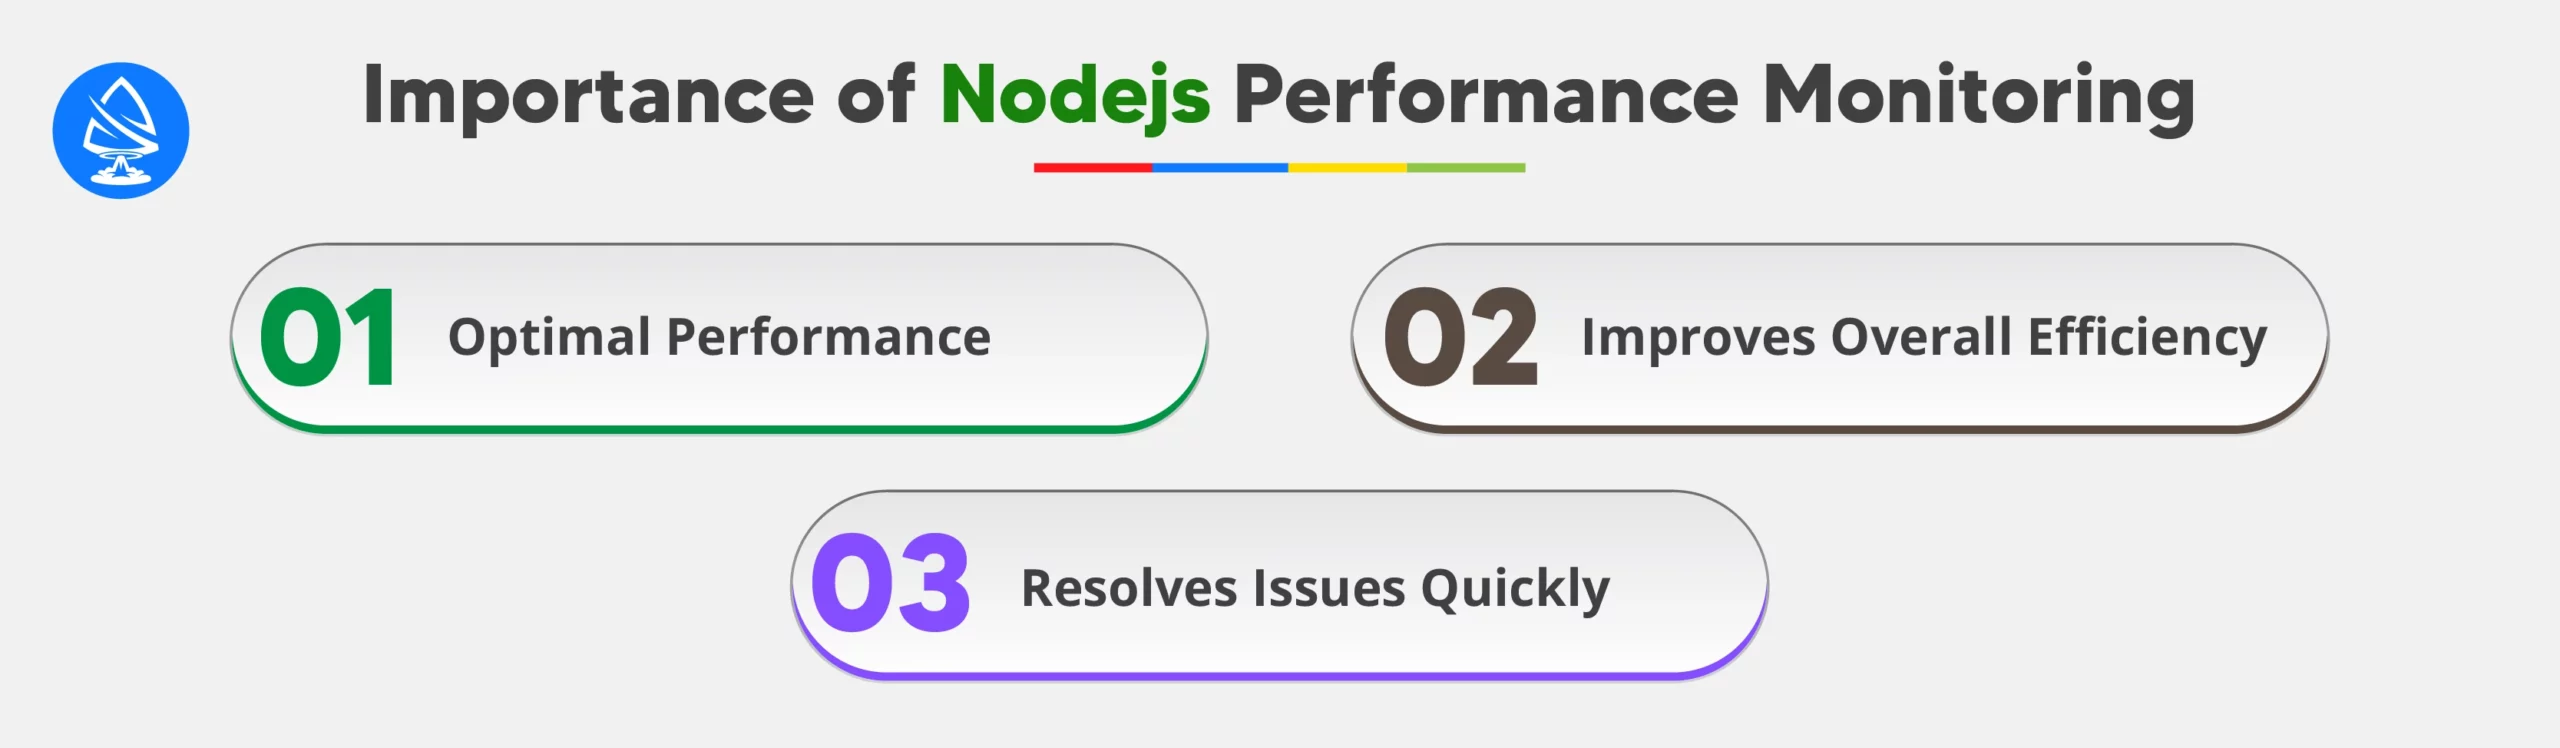
Monitoring is a critical aspect of managing Node.js applications, ensuring their optimal performance and identifying and resolving any potential issues. By implementing proactive monitoring techniques, you can gain valuable insights into the performance of your Node.js server and take necessary actions to improve its efficiency.
One of the primary benefits of Nodejs monitoring is the ability to detect and address performance bottlenecks promptly. Monitoring your application allows you to identify resource-intensive operations, inefficient code, or memory leaks that might impact its overall performance. By proactively monitoring key metrics such as CPU usage, memory consumption, and response times, you can troubleshoot and optimize your application code, leading to improved performance.
Furthermore, Nodejs monitoring enables you to track the availability and responsiveness of your server in real-time. By monitoring key performance indicators like request throughput, error rates, and latency, you can ensure that your application is serving its intended purpose efficiently. Real-time monitoring also helps you identify any sudden spikes in traffic or unexpected behavior that may require immediate attention.
In addition to enhancing performance, monitoring also plays a crucial role in ensuring the stability and reliability of your Node.js applications. By setting up alerts and notifications, you can receive instant notifications when certain thresholds or anomalies are detected. This allows you to proactively address potential issues before they impact the end-user experience. Monitoring also helps you track the overall uptime and availability of your server, allowing you to minimize downtime and provide a seamless user experience.
Overall, Nodejs monitoring is essential for maintaining and optimizing the performance of your applications. By continuously monitoring your server, you can proactively identify and resolve performance bottlenecks, ensure the stability and reliability of your application, and provide a smooth user experience. In the following sections, we will explore different monitoring tools and best practices specifically designed for Node.js applications.
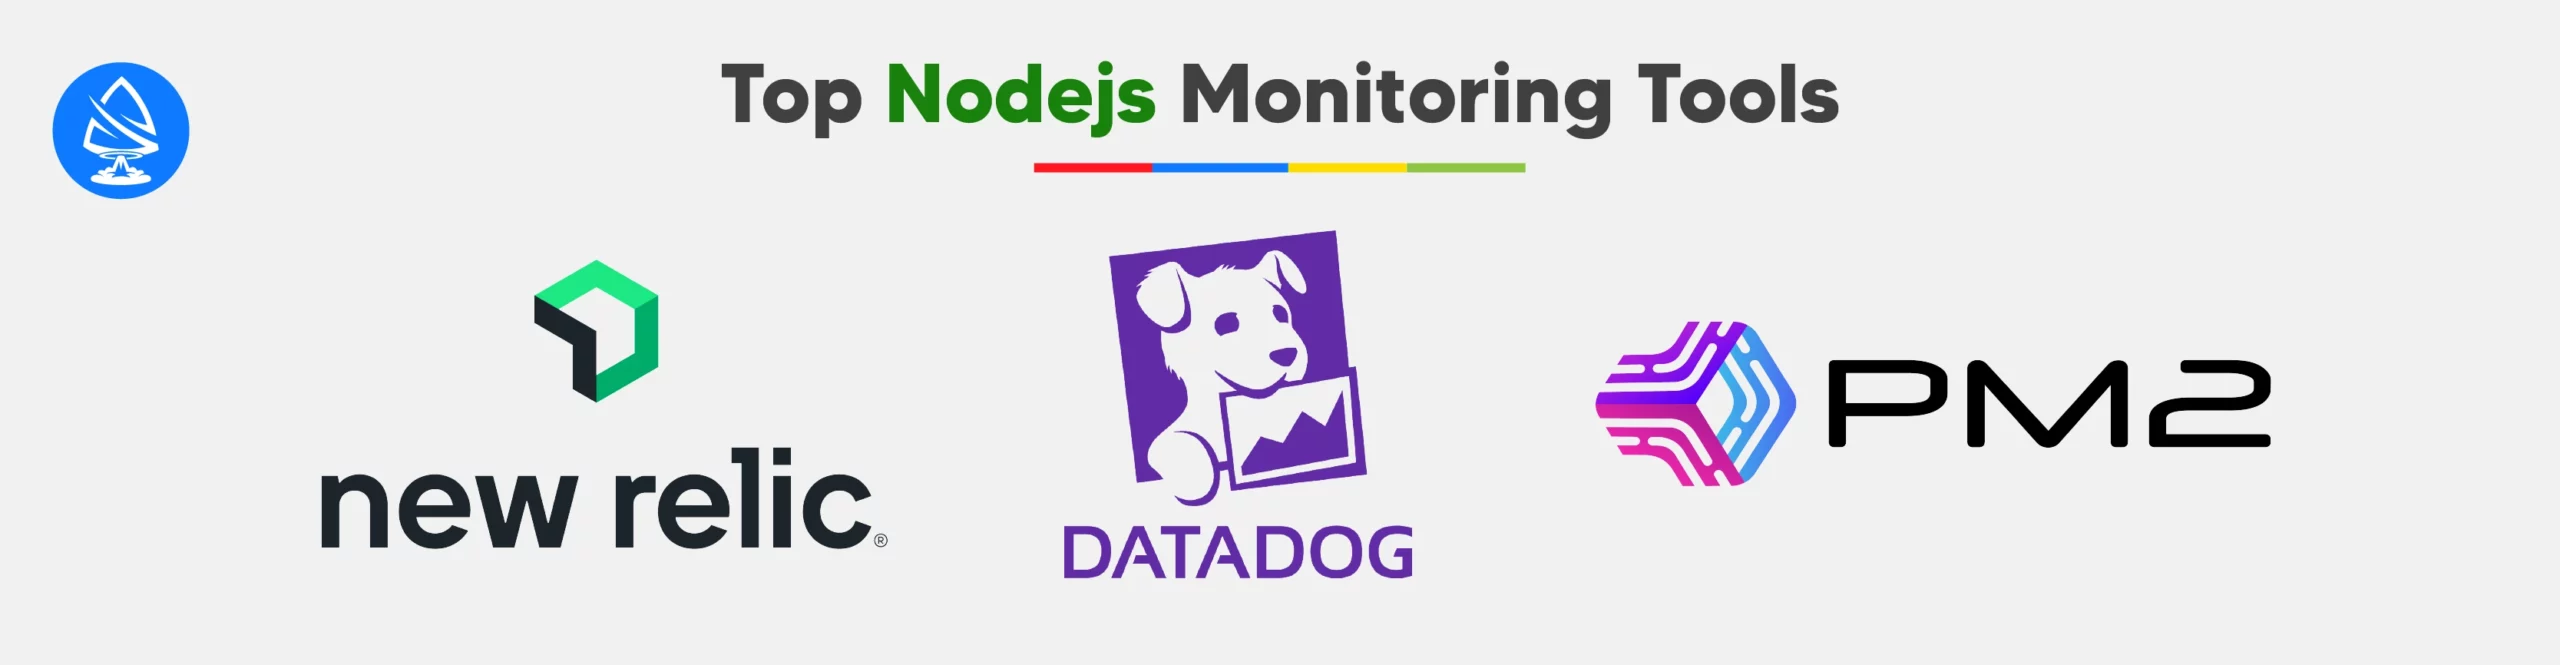
There are several popular monitoring tools available that are specifically designed for Node.js applications. One such tool is New Relic, which provides comprehensive insights into application performance, database queries, and external services. With its real-time monitoring and visualization capabilities, it helps identify potential bottlenecks and optimize the application.
Another widely used tool is Datadog, which offers real-time visibility into your Node.js infrastructure. It allows you to monitor key metrics, trace requests, and set up custom alerts for any performance anomalies. Datadog also provides extensive integrations with other tools and platforms, making it a powerful choice for monitoring complex environments.
PM2 is an open-source process manager for Node.js that also provides monitoring capabilities. In addition to process management, it offers detailed monitoring metrics, deployment automation, and easy log management. PM2 integrates seamlessly with other tools and frameworks, making it popular among developers.
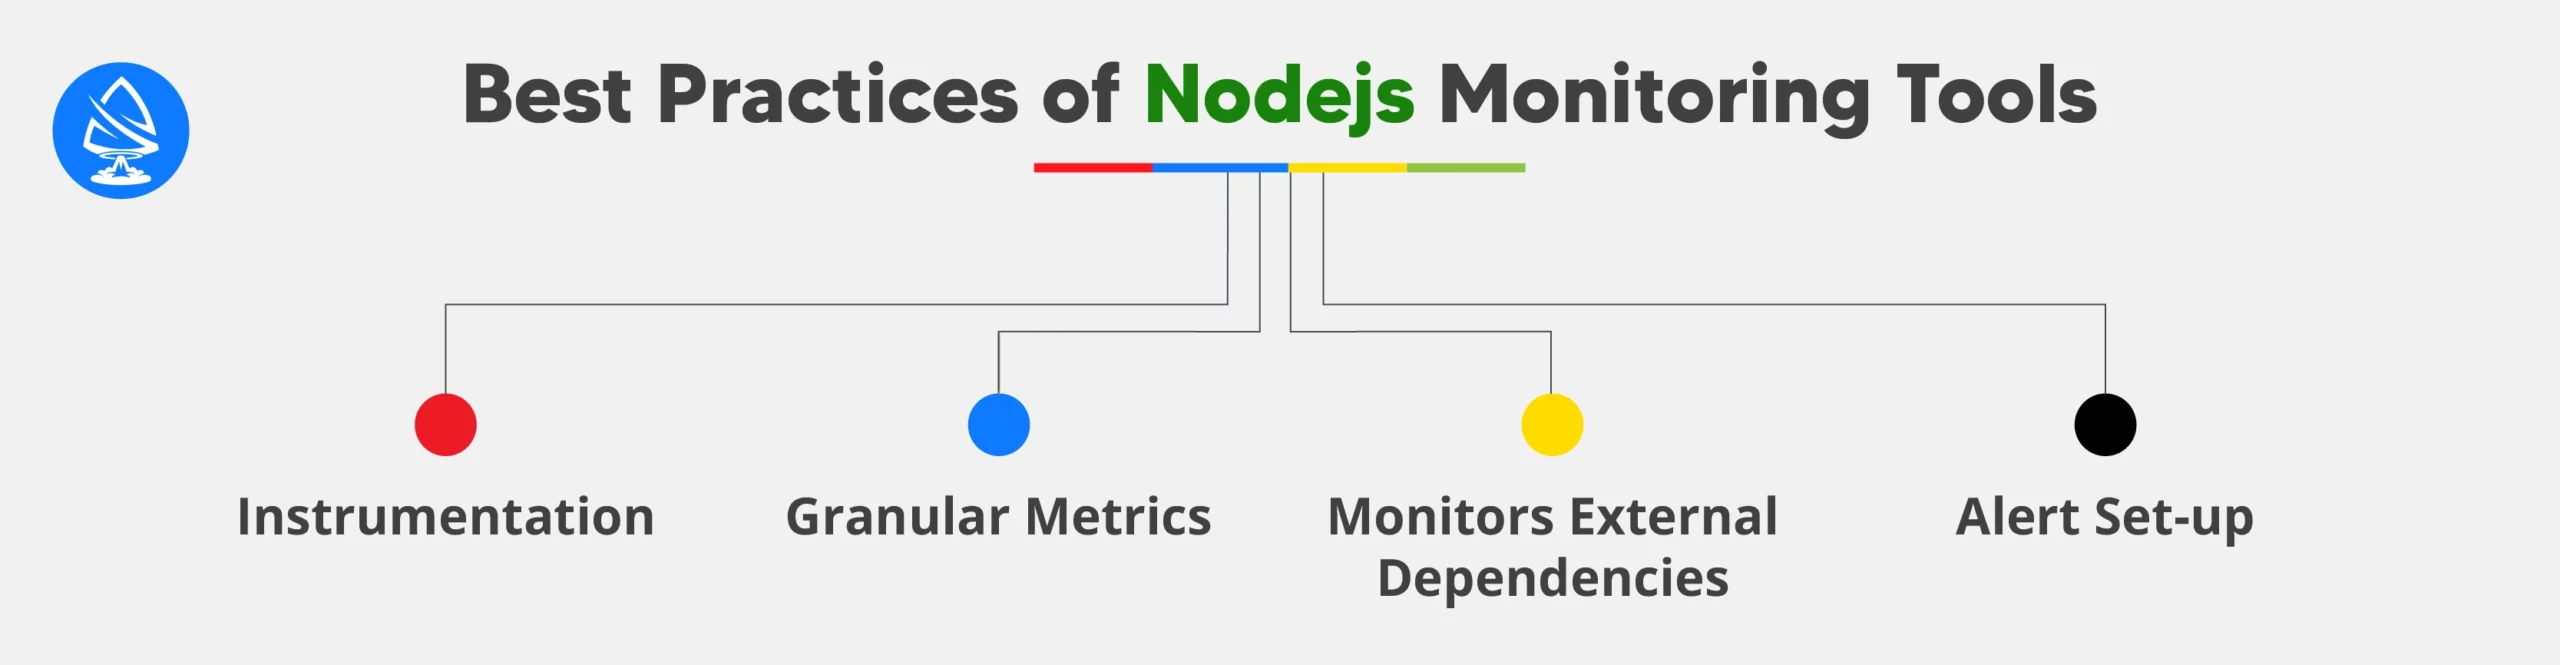
While having the right monitoring tools is crucial, following best practices is equally important to ensure effective node.js monitoring. Here are some key best practices to consider:
By leveraging monitoring tools and implementing best practices, you can effectively monitor your Node.js applications, identify performance bottlenecks, and optimize the overall performance and reliability of your servers.
Real-time monitoring is a crucial aspect of optimizing Node.js performance. By continuously tracking and analyzing performance metrics, you can proactively identify and address issues before they impact your server’s efficiency. Let’s take a closer look at real-time monitoring techniques and their role in ensuring optimal Nodejs performance now.
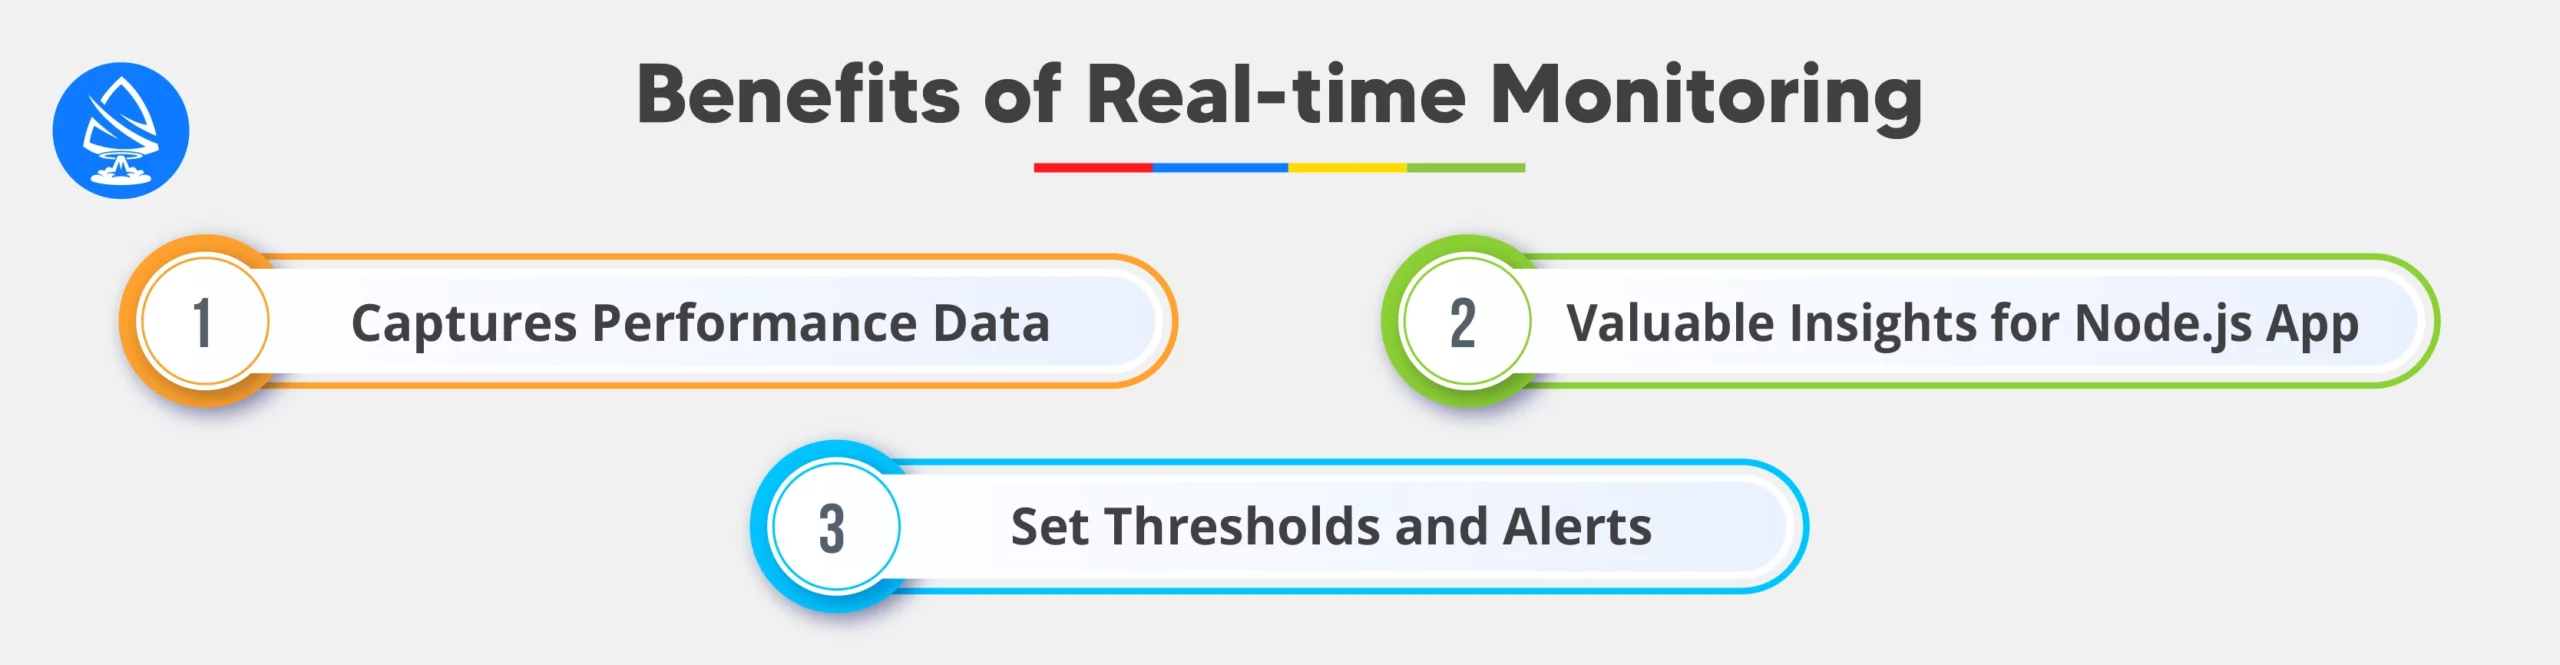
One key benefit of real-time monitoring is the ability to capture performance data as it happens. This allows you to have an up-to-date understanding of your server’s performance and quickly respond to any anomalies or bottlenecks. By monitoring metrics such as CPU usage, memory utilization, response times, and request rates in real-time, you can gain valuable insights into the health and performance of your Node.js applications.
Read More: How To Build Android Apps With Node.JS Using Android JS?
Real-time monitoring also enables you to set thresholds and alerts to notify you when certain performance metrics exceed predefined limits. This proactive approach empowers you to take immediate action, preventing potential downtime or degradation of your Node.js applications. By receiving timely alerts, you can investigate and resolve performance issues promptly, minimizing the impact on your users and ensuring a seamless experience.
To implement real-time monitoring for your Node.js applications, you can leverage various tools and technologies. Some popular options include monitoring platforms like New Relic, Datadog, and Prometheus. These platforms offer comprehensive dashboards, customizable alerts, and performance insights that can help you optimize your Node.js applications effectively.
Additionally, you can utilize Node.js modules such as Node.js Performance Monitoring (npm) and Node.js Event Loop Stats (npm) to collect and analyze performance data within your applications. These modules provide detailed information on event loop latency, resource utilization, and other critical performance metrics.
Real-time monitoring plays a vital role in optimizing Node.js performance. By continuously tracking and analyzing performance metrics, setting alerts, and leveraging monitoring tools, you can ensure that your Node.js applications are performing at their best. Stay tuned as we delve further into performance testing and benchmarking techniques for Node.js in the upcoming sections.
Performance testing and benchmarking are essential practices for evaluating and optimizing the performance of Node.js applications and that’s why nodejs documentation becomes necessary. By measuring and analyzing performance metrics, developers can identify bottlenecks, improve efficiency, and enhance the overall user experience.
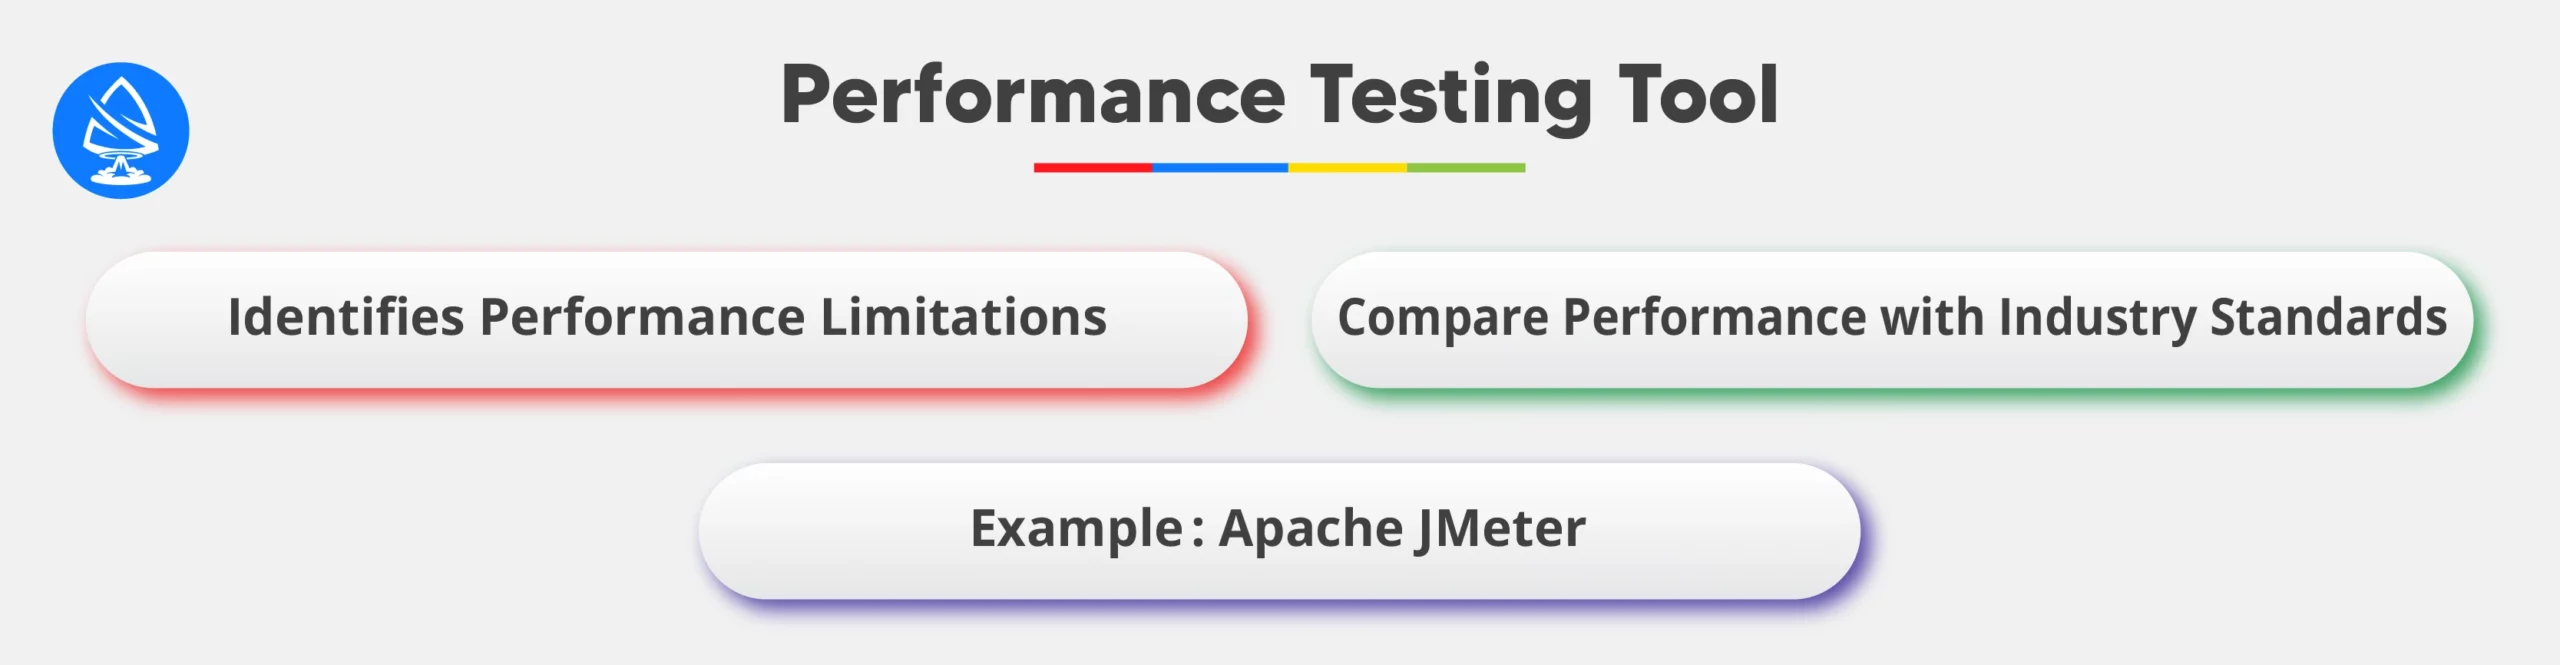
When it comes to performance testing, there are various strategies and tools available that can provide valuable insights. One common approach is to simulate different scenarios and load conditions to observe how the Node.js application responds. This helps identify performance limitations and allows developers to make informed optimizations to improve overall performance.
Furthermore, benchmarking allows developers to compare the performance of their Node.js application to industry standards or similar applications. This involves running tests and analyzing metrics such as response time, throughput, and resource utilization. By benchmarking their application, developers can gain a clear understanding of their performance strengths and weaknesses.
Several tools are commonly used for performance testing and benchmarking Node.js applications. One such tool is Apache JMeter, a powerful open-source tool that allows developers to simulate various scenarios and generate detailed performance reports. Another popular tool is Artillery, which provides a flexible and user-friendly interface for load testing and benchmarking Node.js applications.
It is important to note that performance testing and benchmarking should be an ongoing process, rather than a one-time event. As applications and usage patterns evolve, monitoring and optimizing performance becomes crucial to ensure that the application can handle increasing loads and maintain a satisfying user experience.

When it comes to monitoring the performance of your Node.js applications, metrics and alerts are essential tools. They allow you to track key performance indicators and receive timely notifications about any performance issues that may arise.
Metrics provide valuable insights into the health and efficiency of your Node.js server. By monitoring metrics such as CPU usage, memory consumption, and request latency, you can gain a comprehensive understanding of your application’s performance.
Different types of metrics can be collected, including system-level metrics, application-level metrics, and custom metrics. System-level metrics include CPU usage, memory usage, disk utilization, and network traffic. Application-level metrics, on the other hand, provide insights into the performance of specific components of your application, such as the response time of database queries or the number of concurrent connections to your server.
Read More: How to Select the Right Node.JS Development Company
Setting up alerts is crucial to ensure timely responses to performance issues. By configuring thresholds for specific metrics, you can receive notifications when a metric exceeds or falls below a certain threshold. For example, if the CPU usage goes above 90%, you can set up an alert to trigger an email or a Slack notification to notify you about the high CPU utilization.
When setting up alerts, it’s important to consider the severity of the issue and the impact it may have on your application’s performance. By defining different levels of alert severity, you can prioritize and respond to critical issues promptly.
In addition to metric-based alerts, you can also set up anomaly detection alerts. Anomaly detection algorithms analyze the historical data and detect unusual patterns or anomalies in the metrics. This can help identify performance issues that are not captured by explicit threshold-based alerts.
By effectively monitoring Node.js metrics and setting up alerts, you can proactively identify and address performance issues, ensuring that your application runs smoothly and efficiently.
To enhance the performance of your Node.js applications, it is crucial to identify and address any bottlenecks that may be impacting their efficiency. A bottleneck refers to a point or component within the application where the flow of data or operations is limited, resulting in performance degradation. In this section, we will discuss some common performance bottlenecks in Node.js applications and explore techniques to effectively analyze and resolve them with node releases.
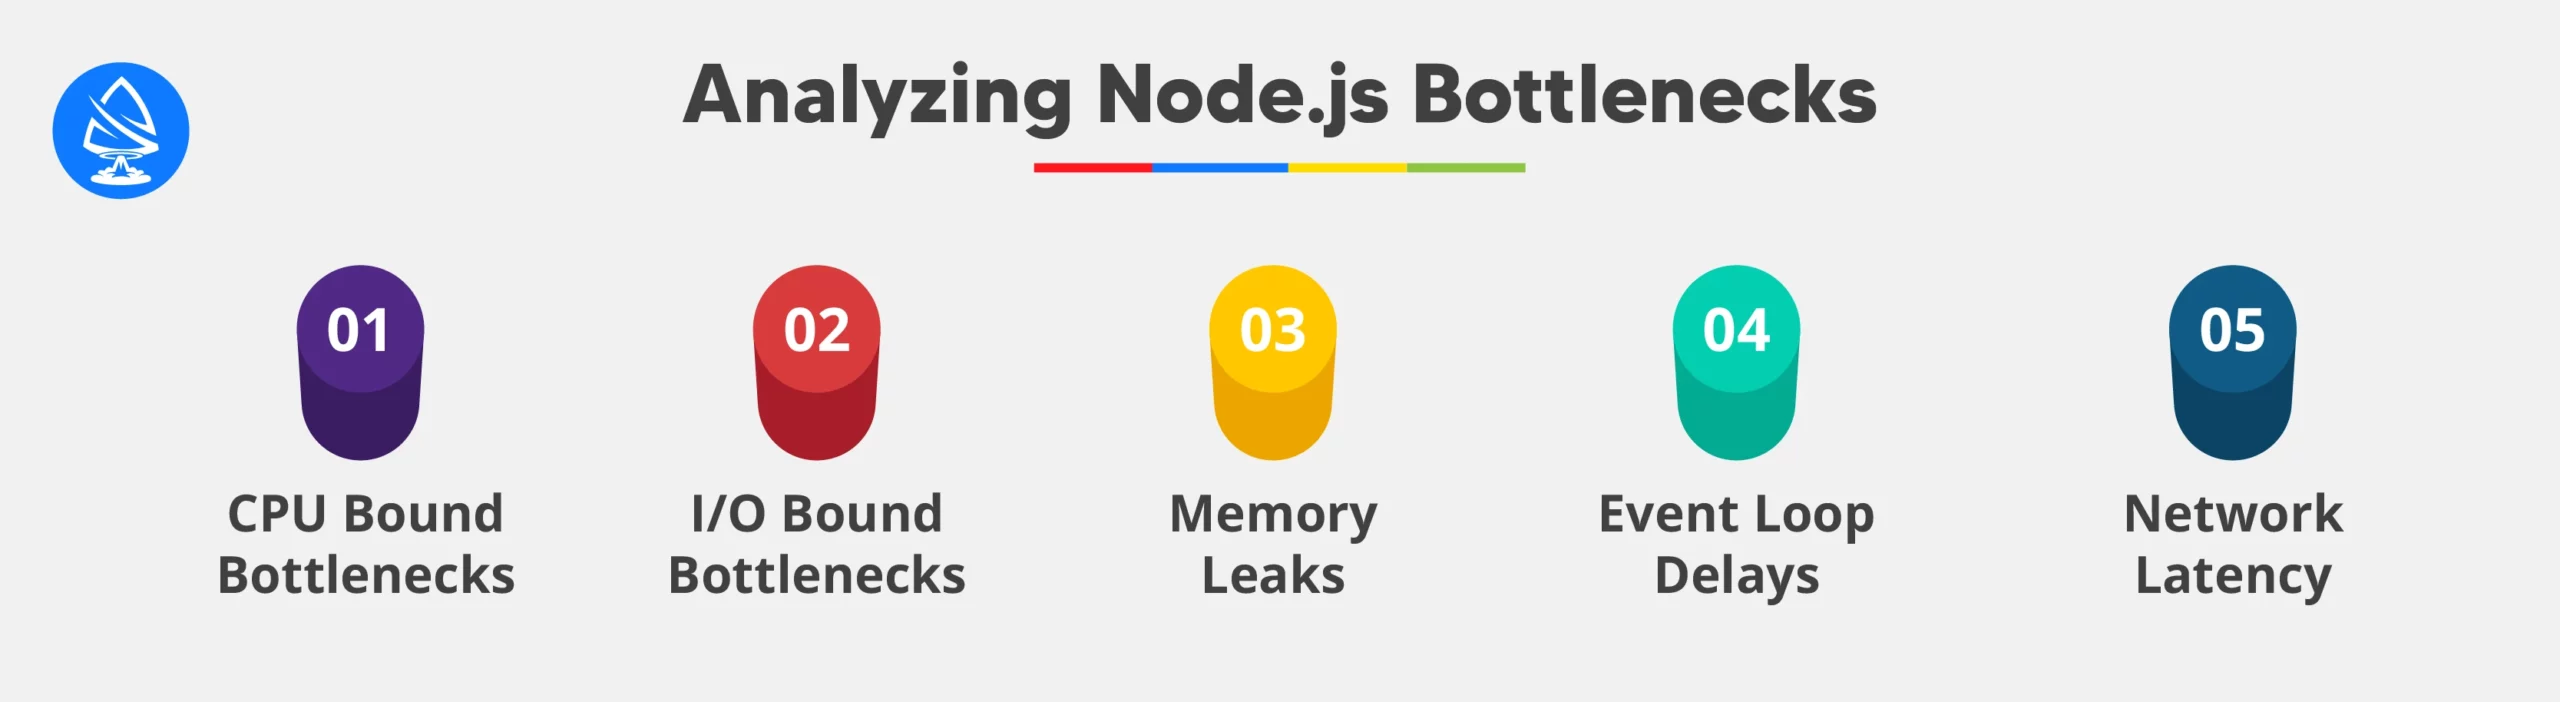
CPU-bound bottlenecks occur when the CPU usage reaches its maximum capacity, causing delays in processing requests and reducing the overall performance of the application. These bottlenecks often arise due to inefficient algorithms, excessive computation, or resource-intensive operations. By using performance monitoring tools like the Node.js Profiler, you can identify the specific functions or modules that are consuming excessive CPU resources. Optimizing these functions, refactoring code, or implementing parallel processing techniques can help alleviate CPU-bound bottlenecks.
I/O bound bottlenecks occur when the application spends considerable time waiting for I/O operations to complete, such as reading from or writing to databases, file systems, or external APIs. This can significantly impact the performance, especially in high-volume scenarios. To analyze and address I/O bound bottlenecks, you can leverage Node.js monitoring tools like Event Loop Latency Monitoring and Async Hooks. These tools provide insights into the latency of I/O operations and help identify areas where optimizations, such as caching or batching requests, can be implemented.
Memory leaks can lead to significant performance issues in Node.js applications, as they gradually consume available memory, ultimately leading to out-of-memory errors or increased garbage collection overhead. To analyze memory leaks, you can use built-in Node.js tools such as the Heap Snapshot Analyzer, express status monitor, and the Memory Inspector. These tools enable you to identify objects or variables that are not properly released, allowing you to refactor the code and implement proper memory management techniques to resolve memory leaks.
The event loop is a crucial component of Node.js applications, and any delays or blockages within it can impact overall performance. These delays can occur due to long-running synchronous operations or blocking functions. By leveraging tools like the Event Loop Monitor, you can identify event loop delays and pinpoint the specific operations causing the blockages. Techniques such as offloading blocking operations to worker threads or using asynchronous alternatives can help alleviate event loop delays and enhance the performance of your Node.js applications.
Network latency can significantly impact the performance of Node.js applications that heavily rely on communication with external services or APIs. To analyze network-related bottlenecks, you can use network monitoring tools like Wireshark or Node.js specific libraries such as Nock. These tools allow you to inspect network requests, measure response times, and identify any issues related to network latency. By optimizing your network requests, implementing caching strategies, or using load balancers, you can mitigate network latency and improve the performance of your Node.js applications.

When dealing with high-traffic Node.js applications, scaling and load balancing are crucial for optimal performance. In this section, we will explore various scaling techniques and discuss the role of load balancing in optimizing Node.js performance.
In this article, we have explored various Node performance monitoring techniques and highlighted their importance in optimizing server efficiency. By implementing these techniques and leveraging monitoring tools, you can ensure optimal performance for your Node.js applications.
Understanding the factors that impact Node.js performance is essential before diving into monitoring techniques. We have discussed key aspects and considerations, enabling you to make informed decisions regarding performance optimization.
So, are you looking for Nodejs development services from a reputed company? Look no further, we have got you covered. Artoon Solutions is a prominent Node js development Agency with the experience of over 14 years of app development.
Contact Us Now!
Node performance monitoring refers to the process of tracking, analyzing, and optimizing the performance of Node.js applications. It involves the collection of various metrics and data points to identify bottlenecks, optimize resource utilization, and improve overall server efficiency.
Several factors can impact Node.js performance, including inefficient coding practices, memory leaks, high CPU usage, I/O bottlenecks, network latency, and improper resource allocation. Understanding and addressing these factors is crucial for optimizing the performance of Node.js applications.
Monitoring Node.js applications is important because it allows developers and system administrators to proactively identify and resolve performance issues. It helps in maintaining optimal server efficiency, reducing downtime, improving user experience, and ensuring overall business continuity.
Some popular Node.js monitoring tools include New Relic, Datadog, AppDynamics, and PM2. Best practices for Node.js monitoring include monitoring CPU and memory usage, tracking response times, implementing log monitoring, setting up automated alerts, and using distributed tracing for performance analysis.
Real-time monitoring allows you to continuously track and analyze Node.js performance metrics. It provides insights into application behavior, helps identify performance anomalies, allows for timely issue resolution, and enables proactive optimization to ensure optimal server performance.
Node.js metrics are quantitative measurements of application performance. These can include CPU and memory usage, request latency, error rates, and more. Alerts can be set up based on predefined thresholds for these metrics, triggering notifications to the appropriate personnel or systems when performance issues or anomalies occur.
Artoon Solutions
Artoon Solutions is a technology company that specializes in providing a wide range of IT services, including web and mobile app development, game development, and web application development. They offer custom software solutions to clients across various industries and are known for their expertise in technologies such as React.js, Angular, Node.js, and others. The company focuses on delivering high-quality, innovative solutions tailored to meet the specific needs of their clients.