- HR:+91-879-9184-787
- Sales:+91-908-163-7774

Are you looking for React Native Charts that will strengthen the information you provide on the application? Want to make your application data rank high? Charts and graphs are the way to go! Charts and graphs have become an essential part of data visualization in mobile applications. With the growing demand for interactive data representation, developers are constantly searching for the best tools to integrate into their applications. But with so many options out there, choosing the right React Native charting library can be tough.
In this guide, we’ll break down what to look for in a good charting library, like a variety of chart types, easy setup, and smooth animations. We’ll also review some popular options to help you pick the perfect one for your app.
Let’s get started!
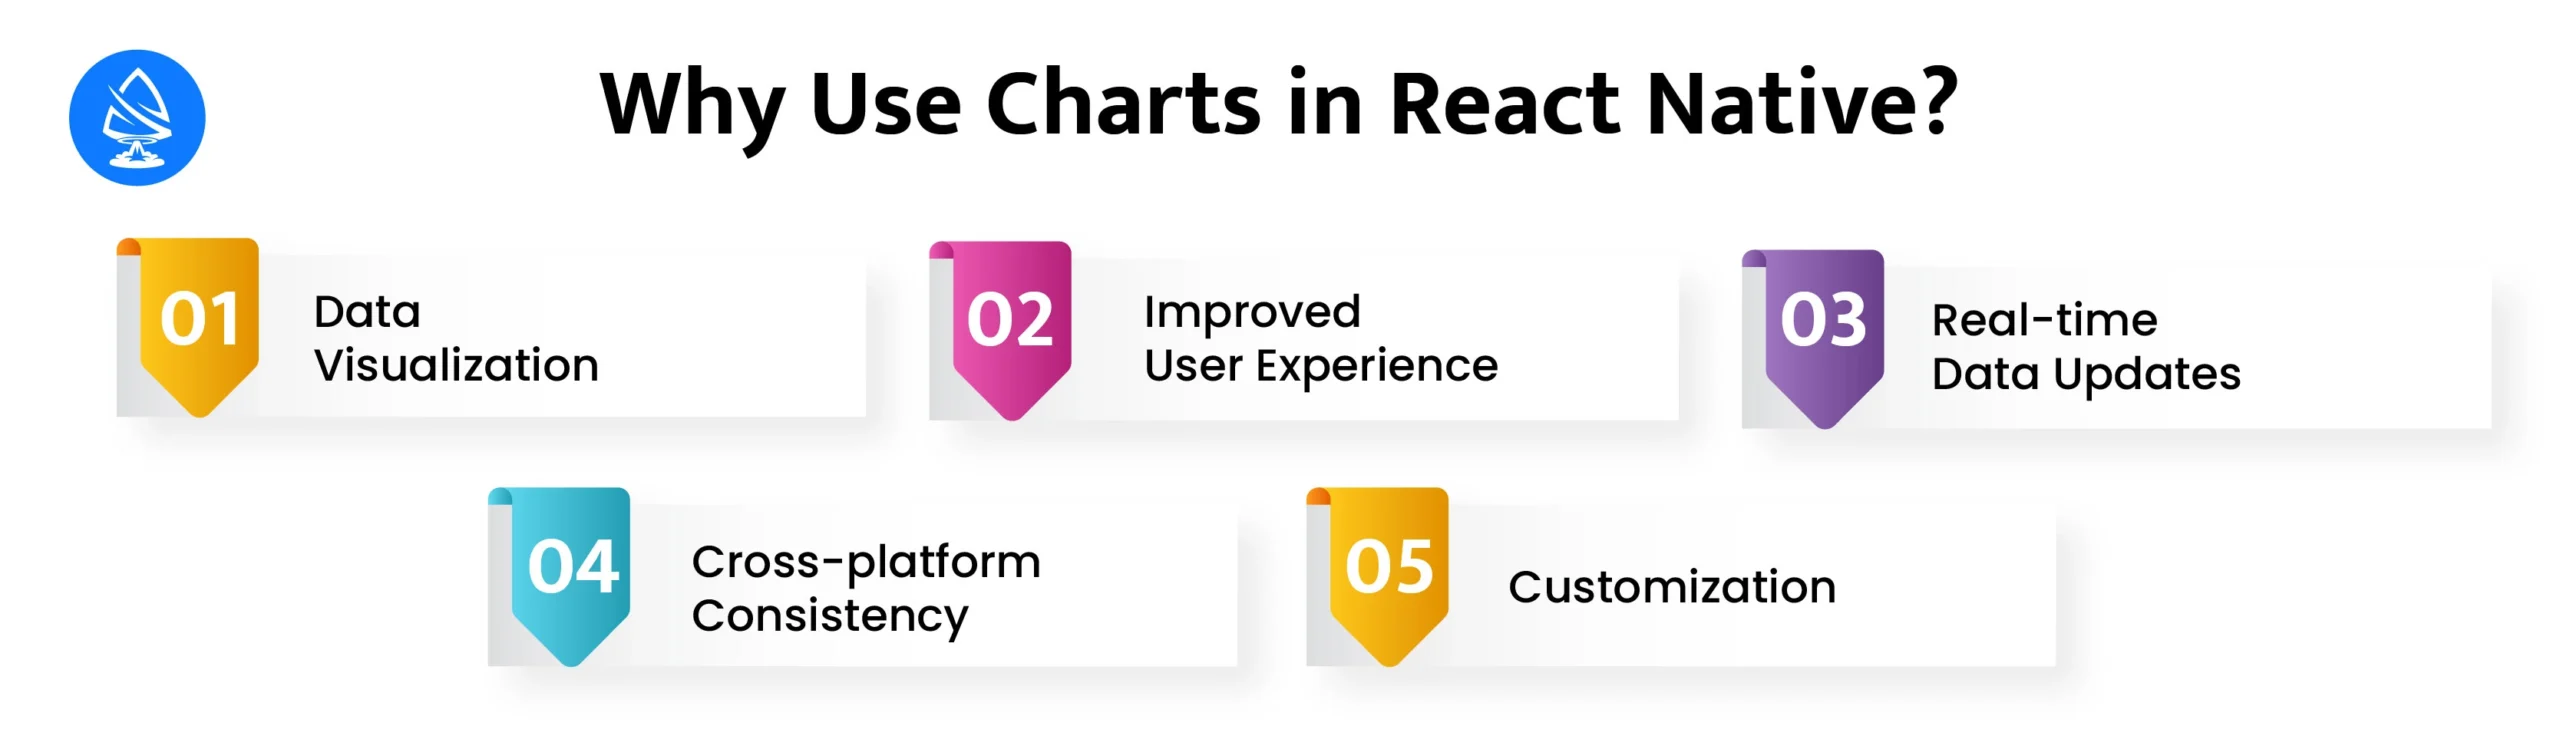
Using charts in React Native is beneficial for several reasons, especially for applications that need to present data visually in a mobile-friendly way:
Now that we know how beneficial it is to use charts in react native, let’s find out the best react native chart libraries for 2025!
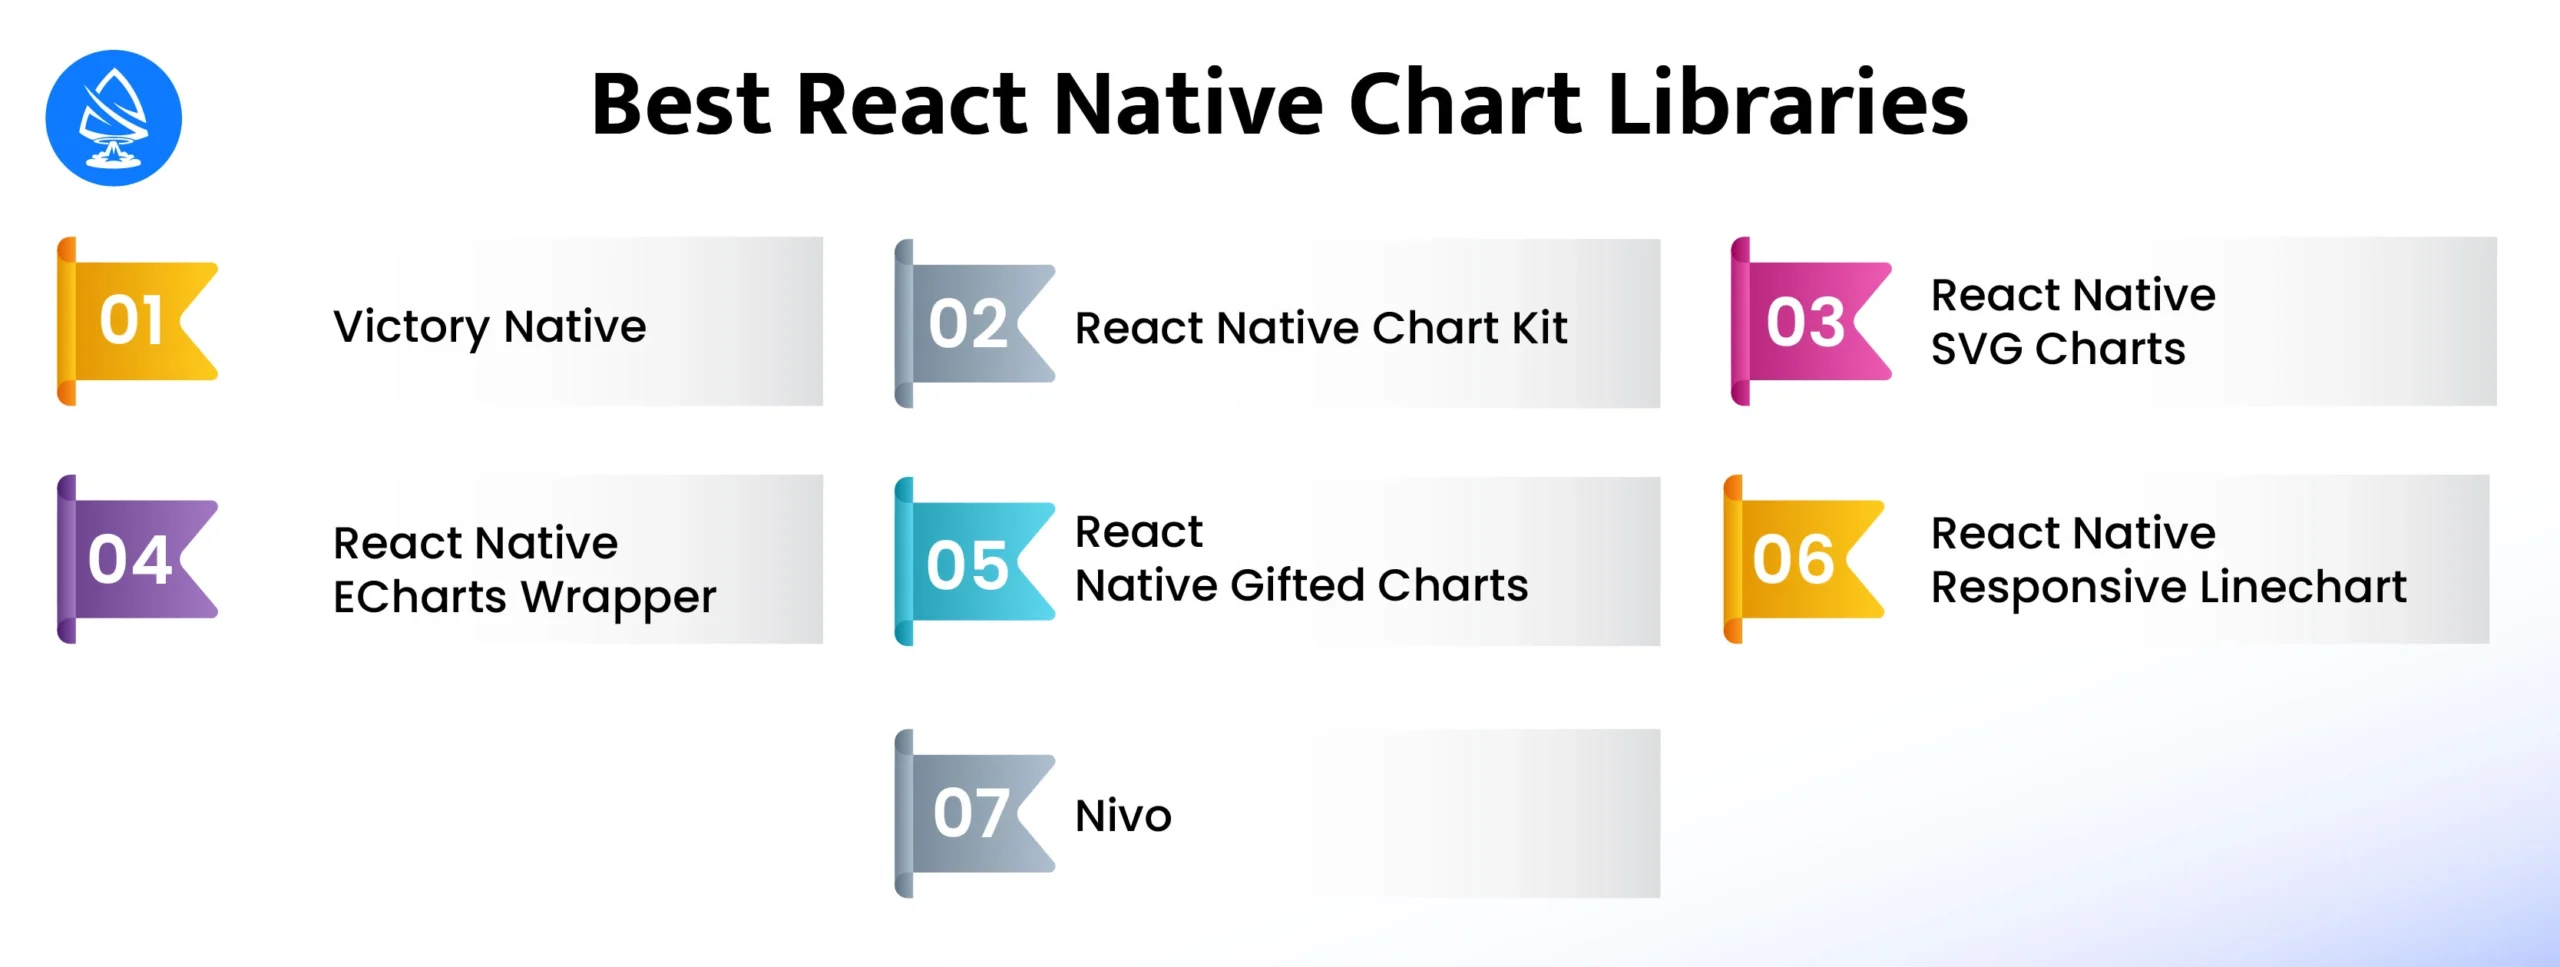
Victory Native is a chart library specifically designed for React Native applications. It is based on the popular Victory library, which is widely used for React applications. Victory Native enables developers to create a wide range of customizable charts, such as bar charts, line charts, pie charts, and more, designed for mobile applications. This library provides a simple and flexible API, making it easy to integrate and customize charts within a React Native app.
Victory Native is highly customizable and allows developers to modify the appearance of charts to fit their app’s design language. Additionally, it supports animations and interaction features, which enhance the user experience by making data visualizations more dynamic and engaging.
Victory Native stands out for its cross-platform compatibility, ensuring that charts render consistently across iOS and Android devices. Its extensive documentation for react native graph library and active community support make it a reliable choice for developers of data-heavy mobile applications.
React Native Chart Kit is a popular charting library for React Native that allows developers to create visually appealing and interactive charts for mobile applications. It is designed to be easy to use while offering a variety of chart types, including line charts, bar charts, pie charts, react native graph, and progress rings. React Native Chart Kit leverages the SVG library, enabling high-quality and scalable chart rendering across different screen sizes and resolutions, ensuring consistency on both iOS and Android platforms.
This charts react native library provides developers with a simple API to integrate charts into their applications quickly. It supports customization of chart styles, including colors, labels, gridlines, and animations, allowing the charts to match the app’s design requirements. Additionally, React Native Chart Kit is lightweight and optimized for performance, ensuring charts load efficiently without affecting app speed.
React Native Chart Kit is well-suited for apps requiring real-time data visualization and provides users with an engaging, data-driven experience.
React Native SVG Charts is a charting library for React Native that uses the power of SVG to create high-quality, scalable charts. It allows developers to build a wide range of charts, such as line charts, bar charts, pie charts, and more, with flexibility and precision. Since it uses SVG for rendering, the charts are highly responsive and maintain clarity across different screen sizes and devices, making it suitable for both iOS and Android platforms.
This library provides developers with a straightforward API to create interactive and customizable charts. It integrates well with existing React Native components, enabling smooth incorporation of charts into any application. Additionally, the library allows for rich customization options like animations, axis labels, gridlines, and chart colors, making it easy to match the charts with the app’s design language.
React Native SVG Charts is an ideal choice for building data-driven mobile apps where visual clarity and performance are crucial.
“Looking for React Native App Development Services? Contact us Now!”
React Native Echarts Wrapper is a library that allows developers to integrate the powerful Echarts library into React Native applications. Echarts is a highly versatile charting library from Apache, known for supporting a wide variety of chart types such as line, bar, pie, scatter, radar, react native graph, and more. With React Native Echarts Wrapper, developers can easily embed these charts into mobile apps, providing users with an intuitive way to visualize data.
The library offers a simplified way to create customizable and interactive charts with features like animations, tooltips, and legends. It supports both static and dynamic data, making it useful for real-time data visualizations. Additionally, React Native Echarts Wrapper is cross-platform, ensuring consistency across iOS and Android devices.
The flexibility of this library allows developers to adapt charts to various use cases, including finance, health tracking, and analytics applications, while maintaining optimal performance.
React Native Gifted Charts is a charting library designed to help developers create simple, customizable charts for React Native applications. It provides a variety of chart types, including line, bar, pie, and stacked charts, making it suitable for different data visualization needs. The library is easy to use, with a clean API that allows developers to quickly integrate charts into their apps without a steep learning curve.
One of the key features of React Native Gifted Charts is its emphasis on customization. Developers can adjust the appearance of charts, such as colors, labels, and gridlines, to match the design of the app. The library also supports smooth animations and interactions, improving the user experience when viewing and exploring data.
React Native Gifted Charts ensures cross-platform functionality, ensuring the same visual consistency on both iOS and Android devices. It’s an ideal choice for developers seeking an efficient and reliable charting solution for mobile apps.
React Native Responsive Linechart is a charting library that focuses specifically on creating responsive line charts for React Native applications. This library is designed to adapt to different screen sizes, ensuring that charts are visually clear and maintain their layout across various devices. It is lightweight and easy to implement, making it a suitable choice for developers looking to add simple line charts to their mobile apps.
The library allows developers to customize the appearance of line charts, including colors, gridlines, and labels, to match the design of their applications. React Native Responsive Linechart is optimized for performance, ensuring that the charts load quickly and perform smoothly, even with dynamic data. It is also designed to work consistently across both iOS and Android platforms.
This library is ideal for apps that need a basic yet effective way to visualize data trends using line charts.
React Native Pie Chart is a library specifically designed for creating pie charts in React Native applications. It offers a simple API that allows developers to add pie charts to their mobile apps easily. This library is ideal for visualizing data that needs to be displayed as proportions or percentages, like market share or sales distribution.
The charts are highly customizable, with options to modify the colors, labels, and legends to match the app’s design. It is optimized for performance, ensuring that pie charts render quickly without affecting the overall app speed. Additionally, React Native Pie Chart works seamlessly across both iOS and Android platforms, ensuring consistent user experience.
React Native Pie Chart is suitable for developers who need a straightforward and efficient solution for pie chart integration in mobile apps.
Nivo is a versatile charting library for React that provides a variety of data visualization options, including bar charts, line charts, pie charts, and more. While it’s primarily built for web applications, Nivo can be integrated into mobile apps using tools like React Native Web. Nivo stands out for its extensive customization capabilities, offering developers control over every aspect of a chart’s appearance, from colors and labels to annotations and tooltips.
Nivo’s charts are interactive, providing real-time data updates and smooth transitions, which is essential for dynamic applications like dashboards. The library is built with responsive design in mind, ensuring charts adjust to different screen sizes and devices. Its performance is optimized, enabling the handling of large datasets efficiently.
Nivo is a robust choice for developers who need feature-rich charts for data-intensive applications.
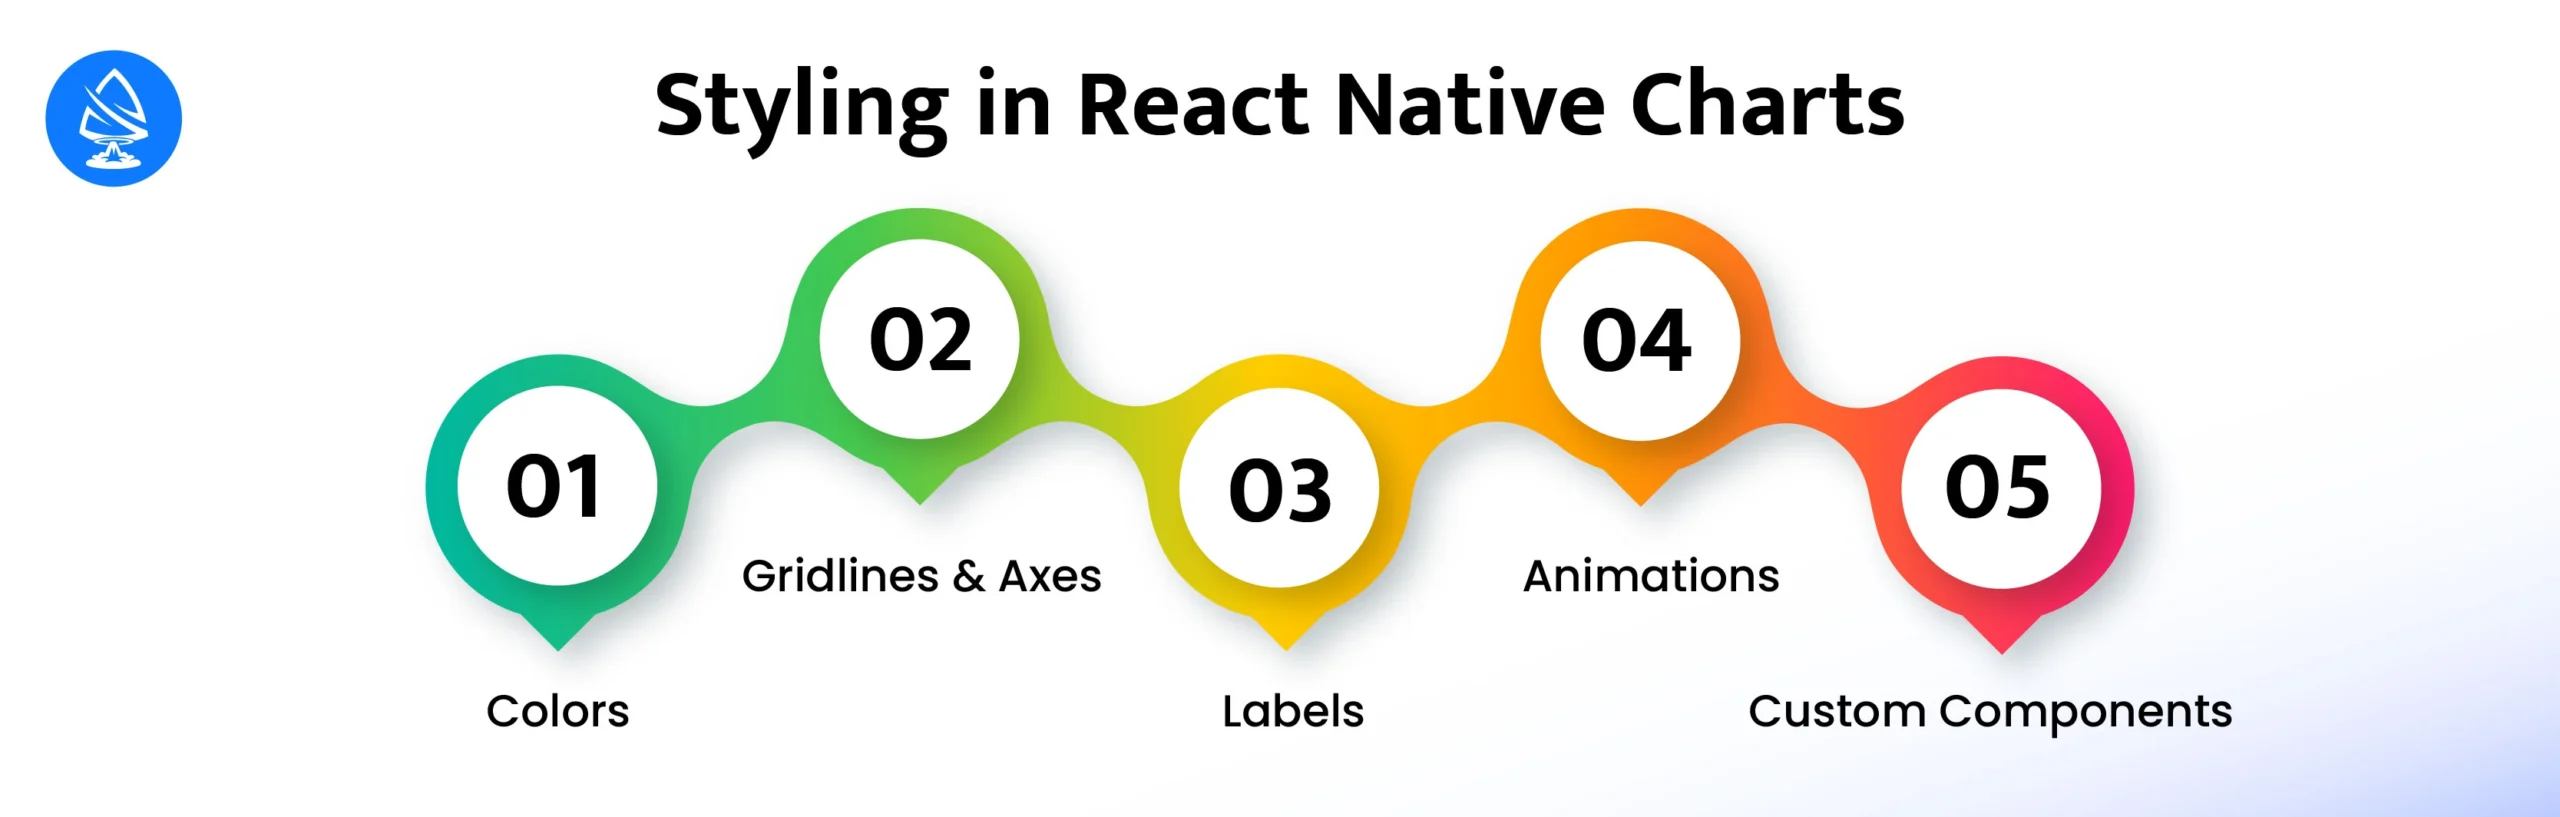
Styling in React Native charts is crucial for creating visually appealing and user-friendly data visualizations. React Native provides several chart libraries like Victory Native, React Native Chart Kit, and React Native SVG Charts, which come with built-in styling options, but you can further customize these charts to suit the design of your application.
Styling charts in React Native involves a combination of the library’s built-in options and using React Native’s standard styling capabilities, ensuring that the charts fit seamlessly into the app’s overall design.
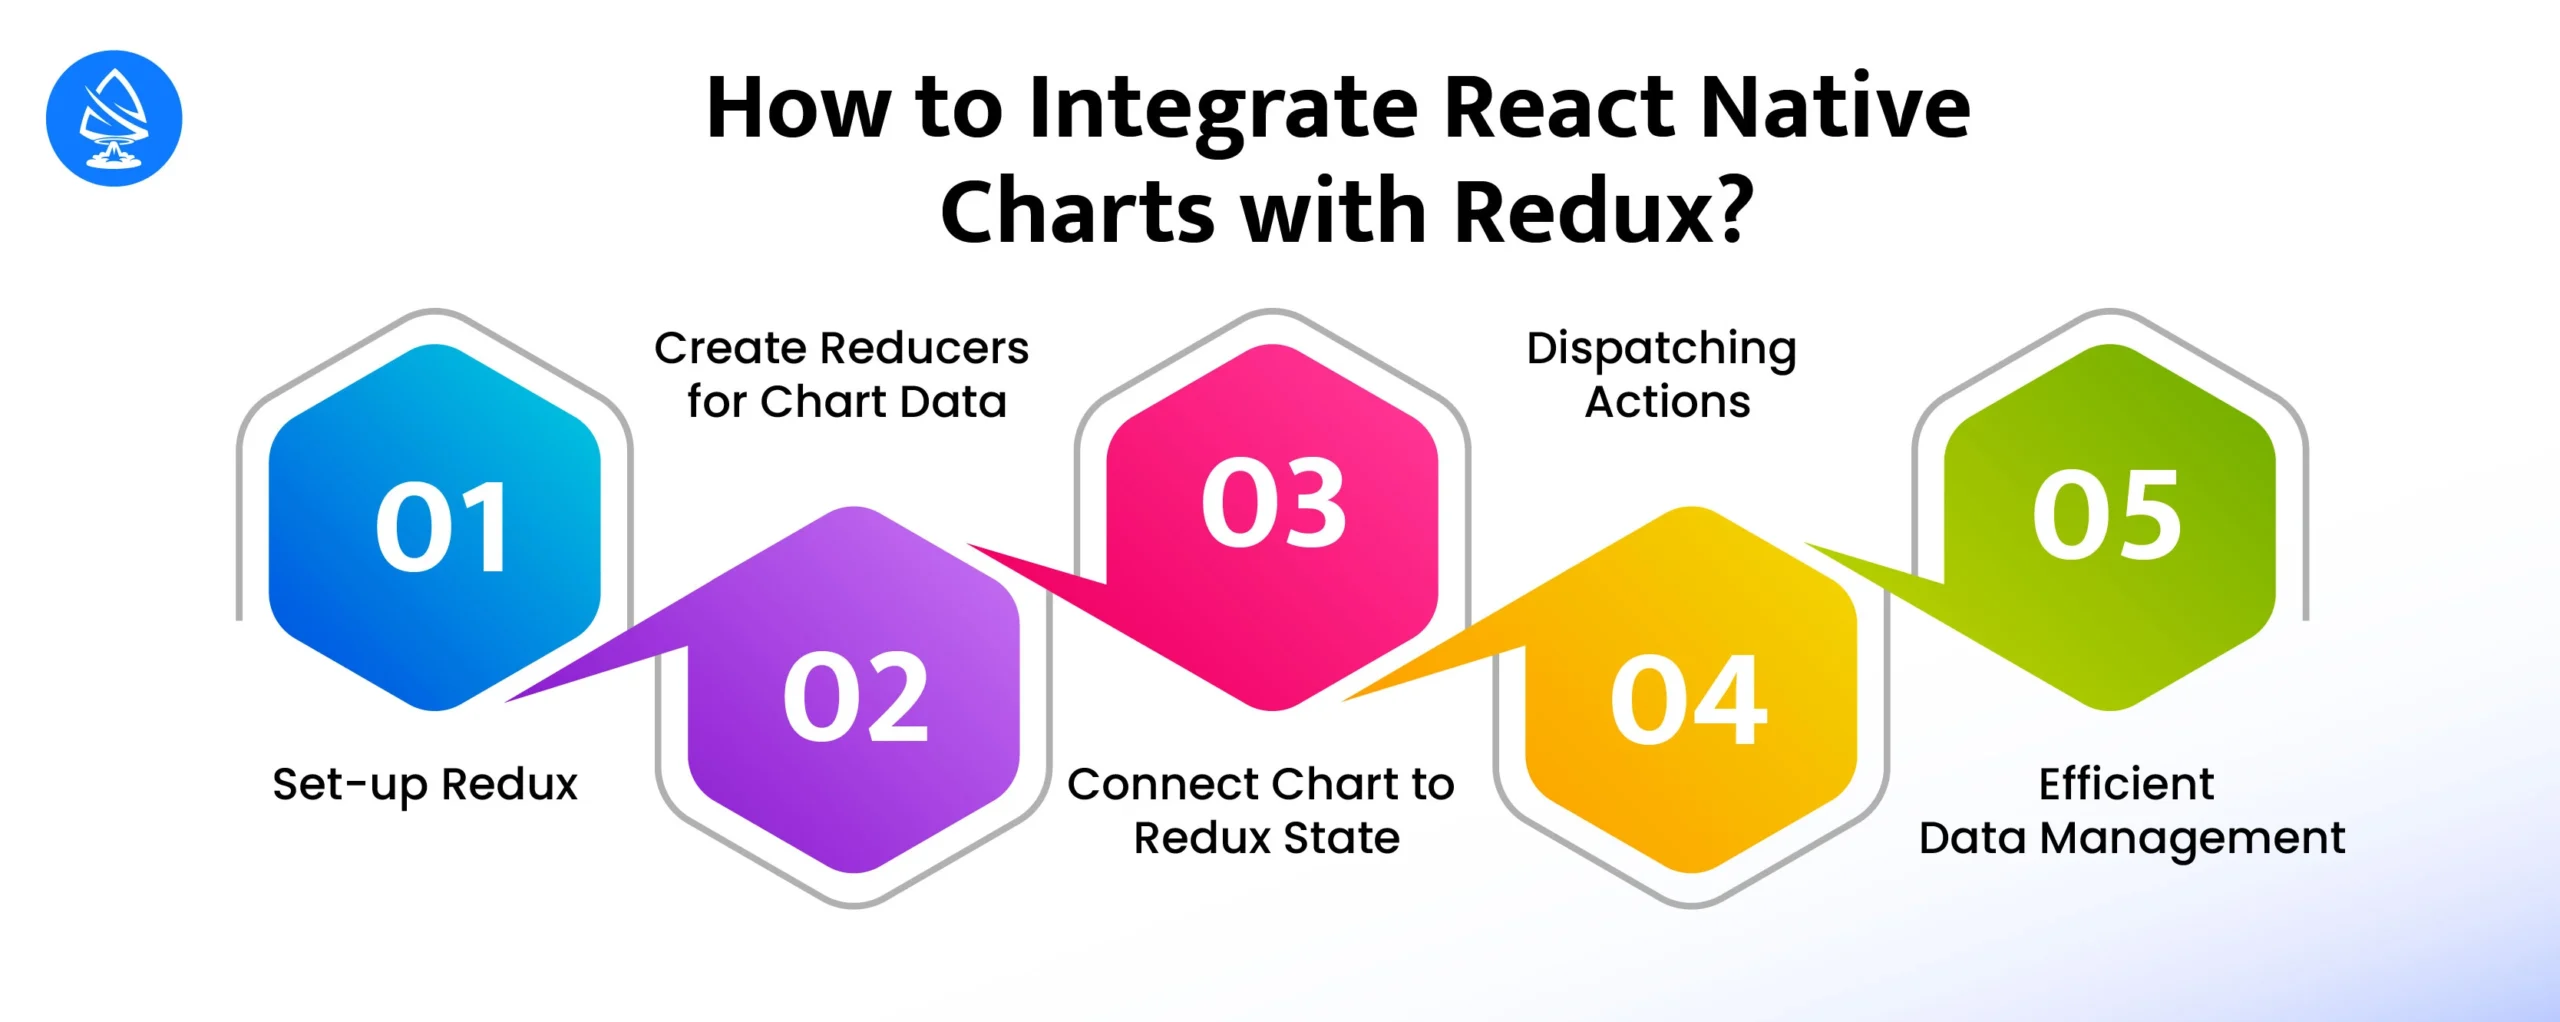
Integrating React Native charts with Redux is a common practice in apps that require state management for complex data flows. Redux helps maintain a centralized state, making it easier to manage data that needs to be reflected in the charts. Here’s how you can integrate React Native charts with Redux:
Integrating React Native and Redux charts ensures that the charts reflect real-time data changes efficiently and consistently across the application. It also simplifies managing large datasets and complex user interactions that require coordinated state changes.

So, which react native charts will you choose for your mobile application? It is crucial for any data-driven application to select a react native chart library that aligns with the requirements. Each of the libraries mentioned above has its strengths, so your choice will depend on your specific needs and the level of customization you’re looking for. Whether you want simple charts or complex visualizations, there’s a library out there for you.
If you want to hire react native app developers, you are at the right place. Contact us now and take a step towards enhancing your mobile application.
Some of the top libraries include Victory Native, React Native Chart Kit, and React Native SVG Charts.
Yes, most libraries offer customization options to match your app’s theme and design.
Absolutely! You can store chart data in Redux and pass it to your chart components for dynamic updates.
If you need help with complex data visualizations or integrating charts into your app, hiring experts can save time and enhance quality.
Charts improve data visualization, making it easier for users to understand trends and insights at a glance.
Artoon Solutions
Artoon Solutions is a technology company that specializes in providing a wide range of IT services, including web and mobile app development, game development, and web application development. They offer custom software solutions to clients across various industries and are known for their expertise in technologies such as React.js, Angular, Node.js, and others. The company focuses on delivering high-quality, innovative solutions tailored to meet the specific needs of their clients.
Copyright 2009-2025